
Enhanced Tracker Reports
If you were eager to begin tracking 2016 recycling & waste data, you may have already noticed that we introduced our enhanced Tracker reports this month. The new reports, available in Tracker and Tracker Light, can be accessed by clicking the links in the side bar. We encourage you to log in to begin generating these new and improved reports.
Overall Report Enhancements
1. Aggregate Results vs. Detailed Results
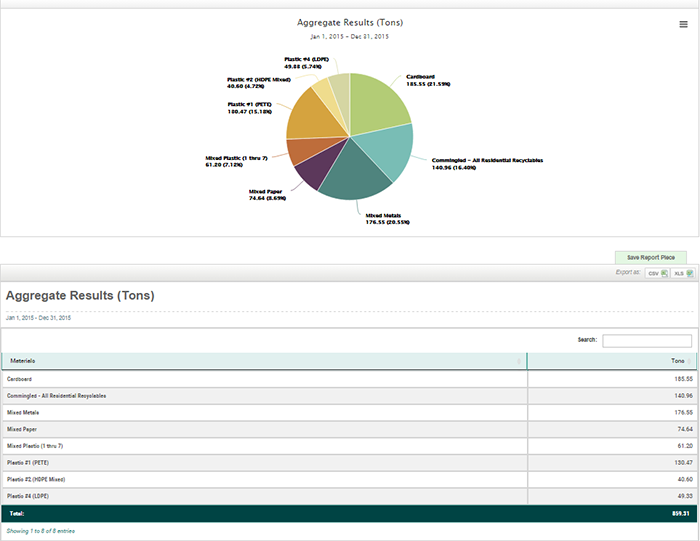
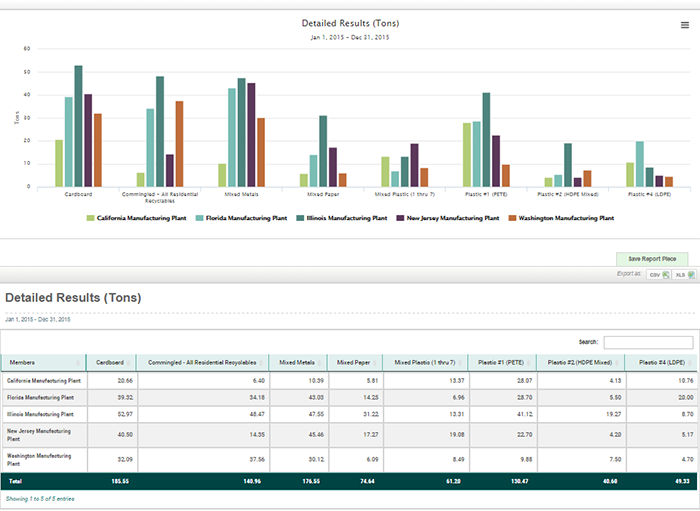
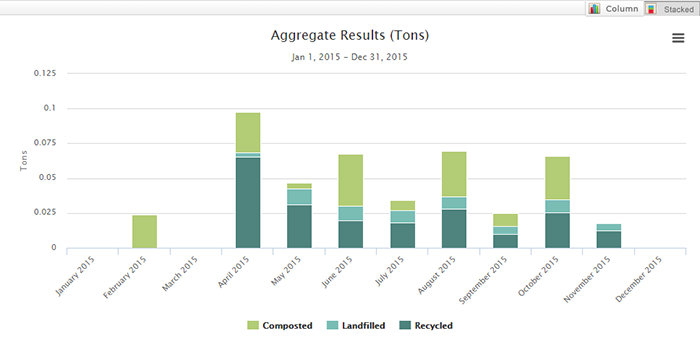
The Material Management, Diversion Rate, and Trend reports are divided into two parts: Aggregate Results and Detailed Results. The Aggregate Results section provides high-level performance metrics while the Detailed Results section provides in-depth metrics designed for comparative analysis.
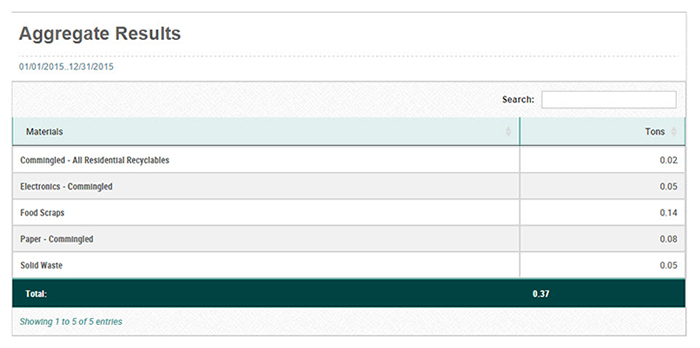
The Aggregate Results section includes a chart and table that summarizes data from all of your locations.
The Detailed Results section, on the other hand, displays a chart and table that show’s each location’s performance.
2. Data Tables
All Tracker reports now use Data Tables which offer search and sorting features. Quickly find a specific data point by using the search box or click any column header to sort your data in ascending or descending order.
3. Export Options
Look out, there’s a new export option in town: Save to PDF. Use this option to save the entire report, including aggregate and detailed results, to a PDF file. Don’t worry, you can still save charts as JPG, PDF, PNG, and SVG and export tables to XLS or CSV.
![]()


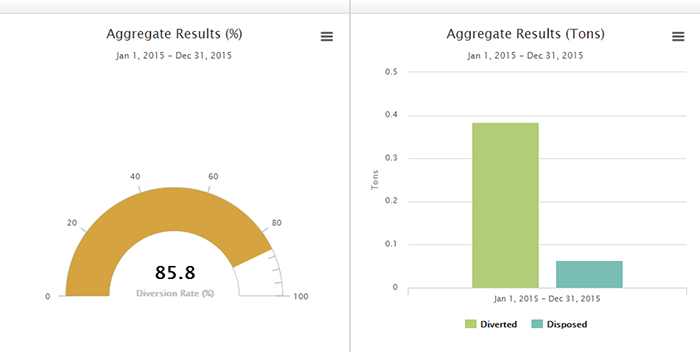
Diversion Rate Report
We combined the Standard Diversion Rate Report and Configurable Diversion Rate Report into one. Calculate your all-time diversion rate and see how your diversion rate changed over time by grouping the results by year or month.
The default configuration includes composted, recycled, reused, and source reduced/waste prevention as diversion activities but you can add or remove activities to generate a report that represents your definition of diversion. You’ll find a new diversion rate gauge next to a chart displaying total weight of materials diverted versus disposed.
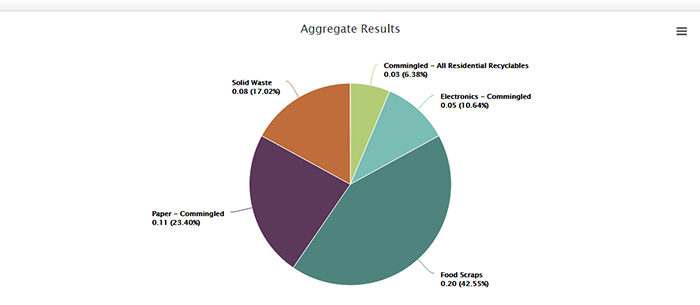
Material Management Report
Formerly known as the Snapshot Report, the Material Management Report provides a moment-in-time view of your data. Analyze your data by material, activity, sector, source, and more.
Trend Report
We knew how much you loved the annual and monthly trend reports so we combined them into one awesome Trend Report. See how your performance charted over time by grouping the results by year or month.
Where is the Environmental Equivalencies Report?
The Environmental Equivalencies Report has been removed from Re-TRAC for the month of January as we complete our replacement: the GHG Equivalencies Report. The new report will include new equivalencies such as wind turbines installed, tree seedlings grown, and incandescent lightbulbs switched to CFL lightbulbs. Keep your eyes open for this report which is scheduled to be released in February.