
All-in-one facility reporting
Easily manage and analyze data collected from landfills, material recovery facilities (MRFs), transfer stations, and composting facilities, all in one place.

%20rotate(-.75)'/%3e%3crect%20class='cls-11'%20x='97.43'%20y='28.27'%20width='2'%20height='7.83'%20transform='translate(-.41%201.28)%20rotate(-.74)'/%3e%3c/g%3e%3cpolyline%20class='cls-2'%20points='88.22%2042.29%2098.71%2052.79%20110.14%2041.59'/%3e%3cpolyline%20class='cls-2'%20points='88.22%2042.29%2098.71%2052.79%20110.14%2041.59'/%3e%3cg%3e%3cline%20class='cls-7'%20x1='10.01'%20y1='100.74'%20x2='21.76'%20y2='100.59'/%3e%3cline%20class='cls-1'%20x1='25.68'%20y1='100.54'%20x2='33.18'%20y2='100.44'/%3e%3c/g%3e%3cg%3e%3crect%20class='cls-9'%20x='10.01'%20y='99.69'%20width='7.83'%20height='2'%20transform='translate(-1.33%20.19)%20rotate(-.76)'/%3e%3crect%20class='cls-9'%20x='25.68'%20y='99.49'%20width='7.5'%20height='2'%20transform='translate(-1.32%20.4)%20rotate(-.76)'/%3e%3c/g%3e%3cpolyline%20class='cls-1'%20points='23.3%20110.9%2034.01%20100.64%2023.06%2088.97'/%3e%3cpolyline%20class='cls-1'%20points='23.3%20110.9%2034.01%20100.64%2023.06%2088.97'/%3e%3cg%3e%3cline%20class='cls-4'%20x1='165.68'%20y1='100.94'%20x2='173.17'%20y2='100.84'/%3e%3cline%20class='cls-6'%20x1='181.01'%20y1='100.74'%20x2='192.76'%20y2='100.59'/%3e%3c/g%3e%3cg%3e%3crect%20class='cls-10'%20x='165.68'%20y='99.89'%20width='7.5'%20height='2'%20transform='translate(-1.27%202.16)%20rotate(-.73)'/%3e%3crect%20class='cls-10'%20x='181.01'%20y='99.69'%20width='7.83'%20height='2'%20transform='translate(-1.26%202.36)%20rotate(-.73)'/%3e%3c/g%3e%3cpolyline%20class='cls-4'%20points='175.77%20110.9%20165.06%20100.64%20176.01%2088.97'/%3e%3cpolyline%20class='cls-4'%20points='175.77%20110.9%20165.06%20100.64%20176.01%2088.97'/%3e%3cpath%20class='cls-5'%20d='M164,156.46H35.25c-3.16,0-5.04-3.52-3.29-6.15l12.68-13.62h109.97l12.68,13.62c1.75,2.63-.13,6.15-3.29,6.15Z'/%3e%3cpath%20class='cls-5'%20d='M164,156.46H35.25c-3.16,0-5.04-3.52-3.29-6.15l12.68-13.62h109.97l12.68,13.62c1.75,2.63-.13,6.15-3.29,6.15Z'/%3e%3cpath%20class='cls-8'%20d='M54.4,70.69h89.38c1.66,0,3,1.34,3,3v52.2H51.4v-52.2c0-1.66,1.34-3,3-3Z'/%3e%3cpath%20class='cls-8'%20d='M54.4,70.69h89.38c1.66,0,3,1.34,3,3v52.2H51.4v-52.2c0-1.66,1.34-3,3-3Z'/%3e%3c/svg%3e)
Centralize reporting

Measure total capacity

Monitor material flows

Track tipping fees & charges
Easily manage and analyze data collected from:
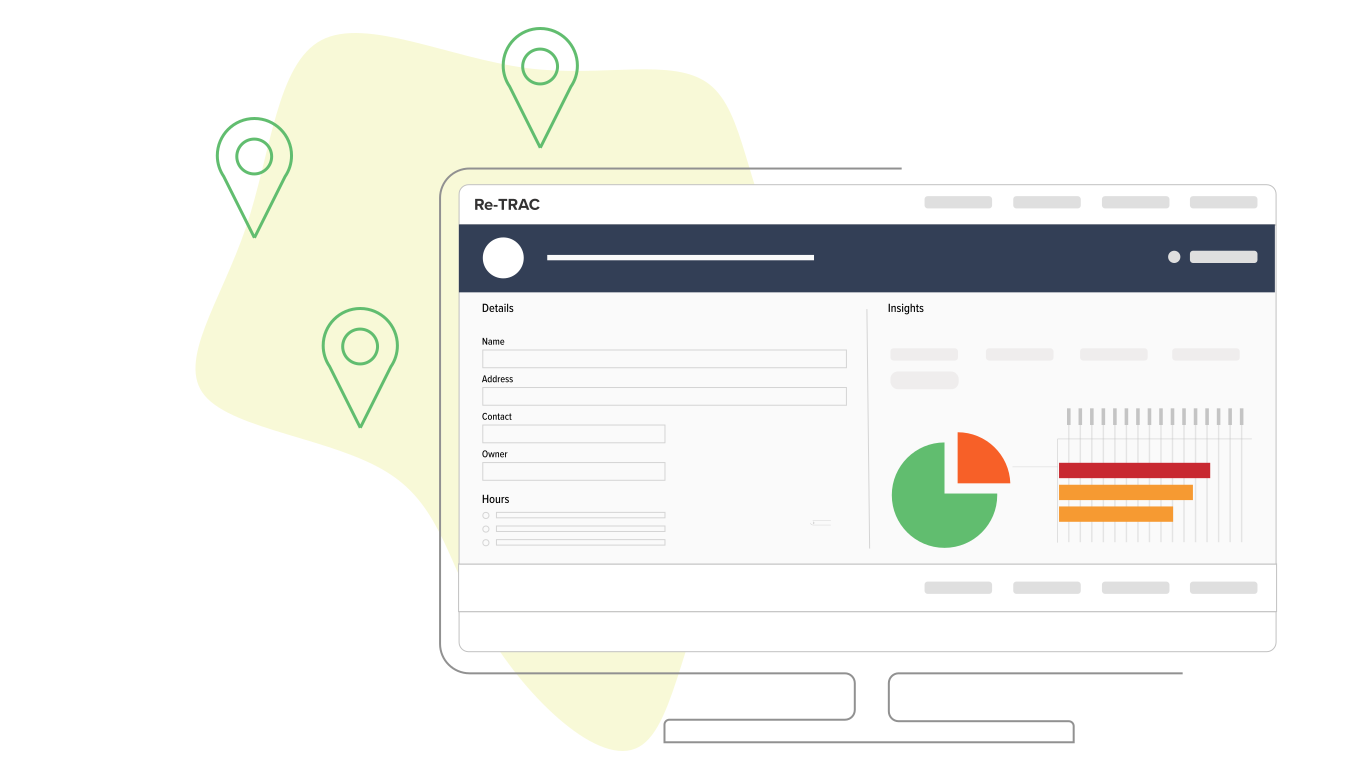
Profile the landfills in your jurisdiction
Start with the essentials
Collect fundamental information about each of the landfills operating in your jurisdiction including facility name, address, contact information, landfill type, ownership details, and hours of operation.Understand operating capacity & materials accepted
Take inventory of each landfill's remaining capacity, permit information, service restrictions, design features, and materials accepted.Track tipping fees & other charges
Measure each landfill's published tipping fees and document other charges such as drop-off service fees.
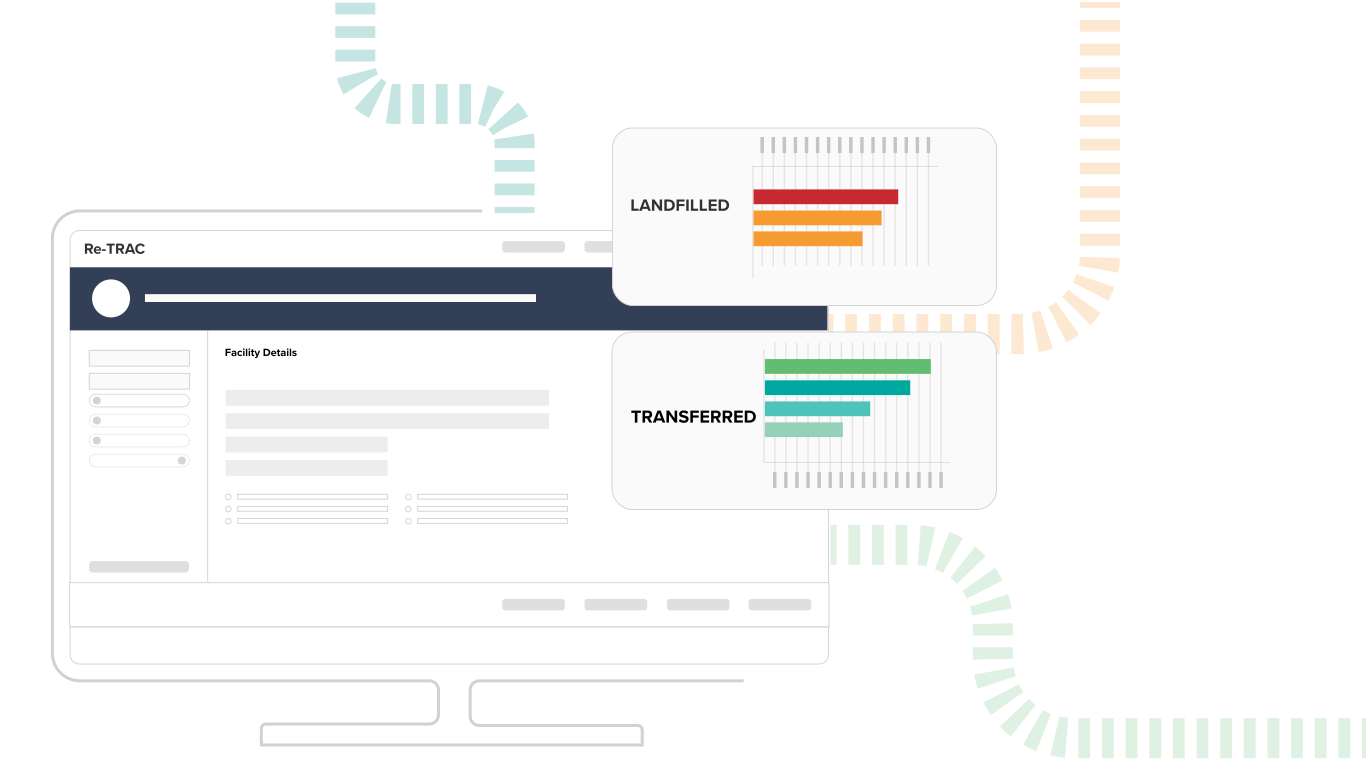
Measure material flows and disposal
Track disposal and transfers
Measure the total tons of municipal solid waste (MSW), construction & demolition (C&D), and other non-hazardous materials landfilled or transferred to other facilities.Segregation & beneficial use
Collect details about the amount of recycling, organics, and electronic scrap segregated from incoming waste streams and identify materials that were diverted for beneficial use.Detailed material flows
Take your data further by collecting information about materials received from transfer stations, neighboring communities, or out-of-state origins, and measure the amount of materials exported to other facilities or jurisdictions.
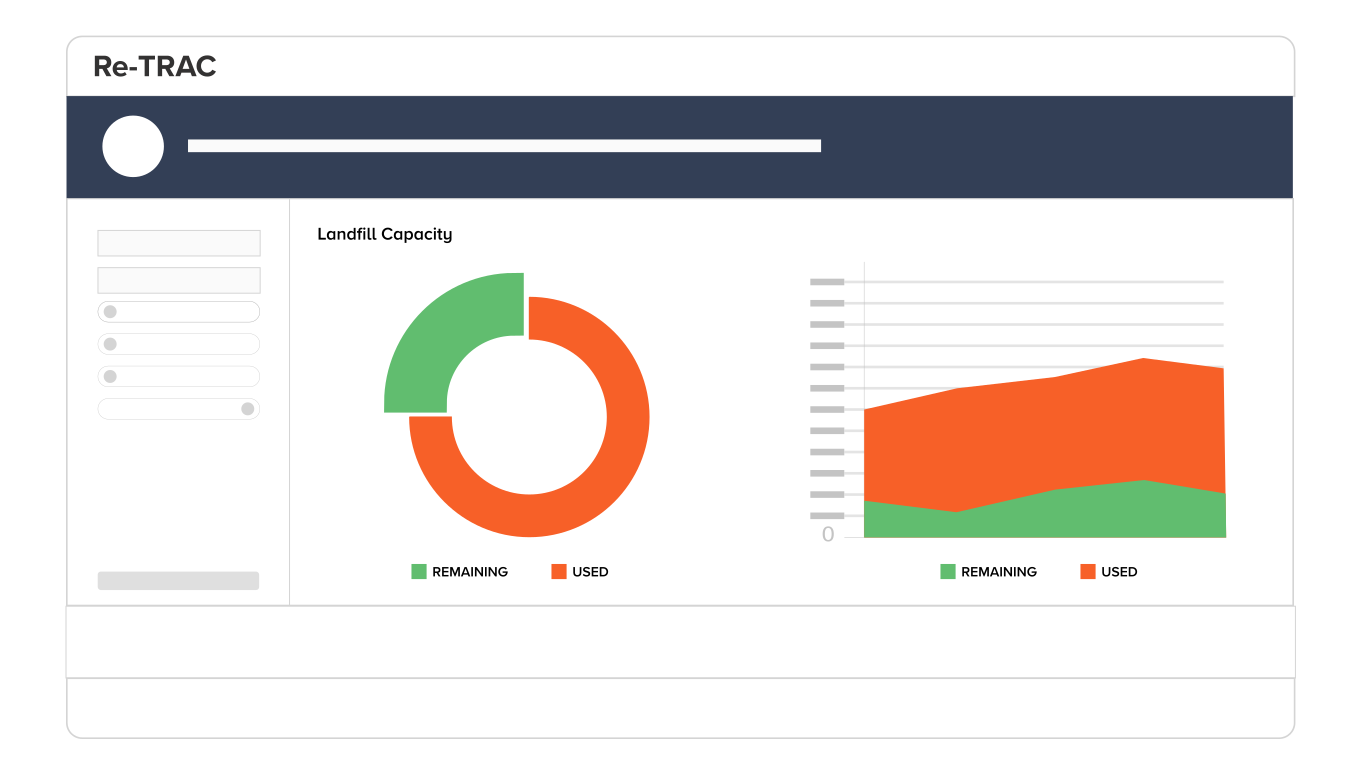
Put your data to work
Disposal analysis
Calculate the total amount of waste that was landfilled in your jurisdiction, across all landfill types.Tipping fee analysis
Measure the average tipping fee charged by landfills operating in your jurisdiction and trend these averages over time.Landfill capacity remaining
Calculate the total remaining permitted landfill capacity to inform expansion projects or new facility construction plans.
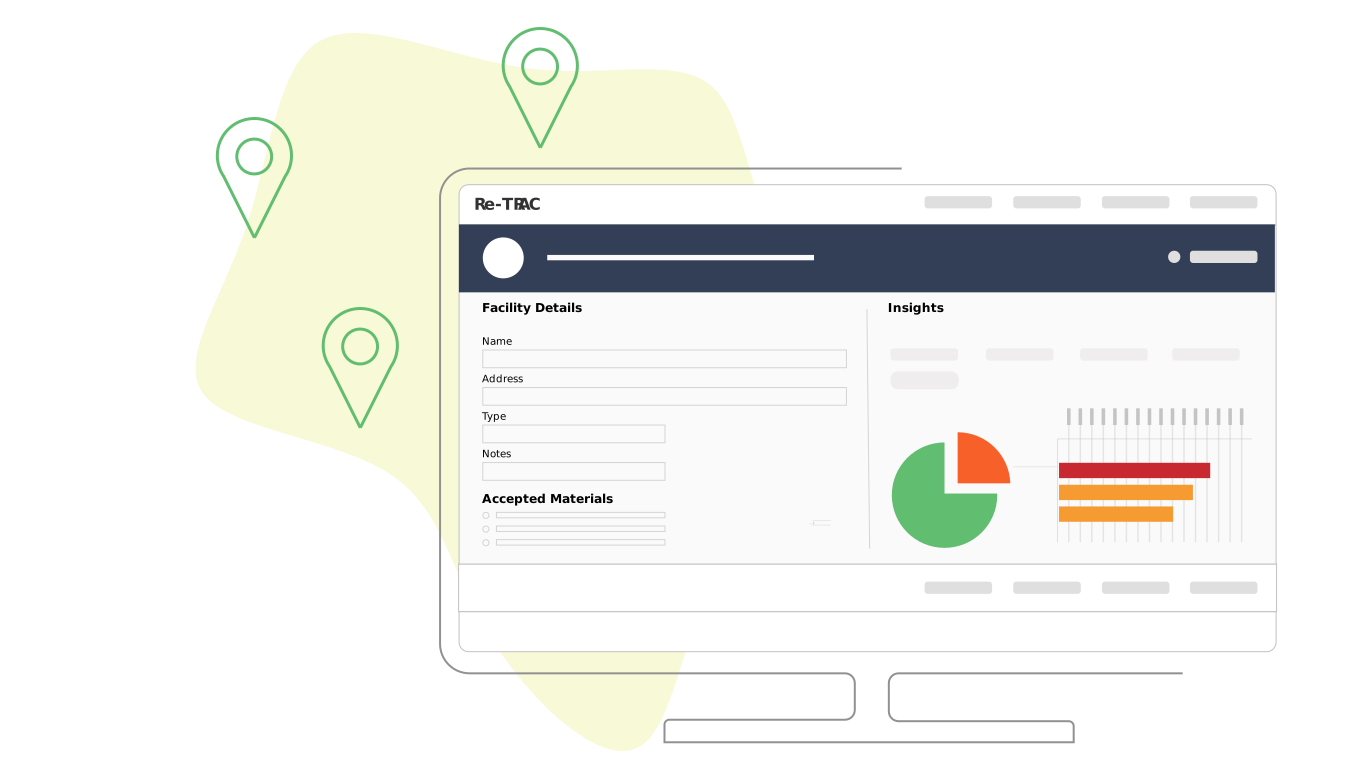
Profile the transfer stations in your jurisdiction
Start with the essentials
Collect fundamental information about each transfer station operating in your jurisdiction including facility name, address, contact information, permits, ownership details, and hours of operation.Understand operating capacity & materials accepted
Take inventory of each transfer station's capacity, permit information, service restrictions, design features, and materials accepted.Track tipping fees & drop-off rates
Measure each transfer station's published tipping fees and applicable drop-off rates for residents and non-residents.
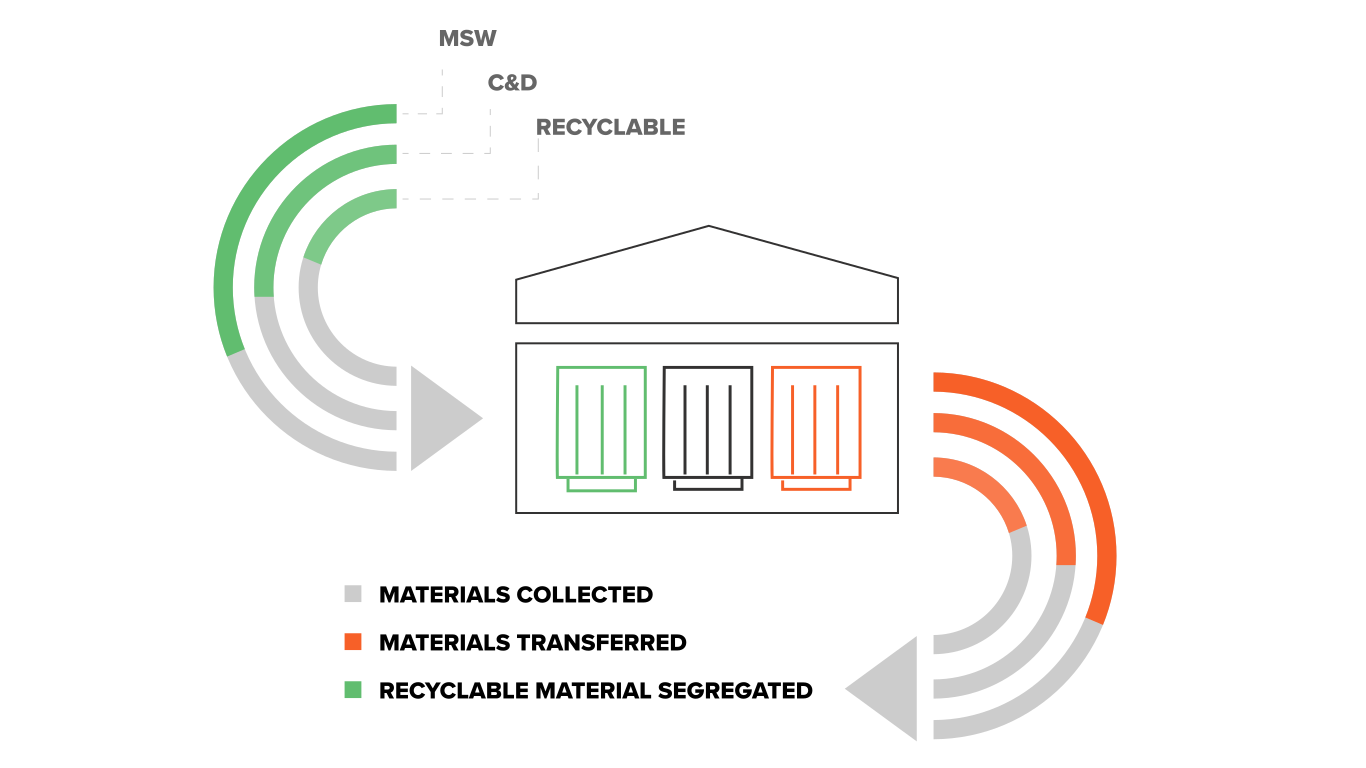
Measure inbound & outbound materials
Measure the amount of waste received
Capture the total tons of inbound municipal solid waste (MSW), construction & demolition (C&D), recyclables, and the amount transferred to other facilities.On-site recycling & material segregation
Measure the amount of recyclables that were segregated from incoming waste streams and identify any on-site recycling activities.Detailed material flows
Get granular by measuring the tons of waste received from each community or business and the amount of materials exported to other facilities or jurisdictions.
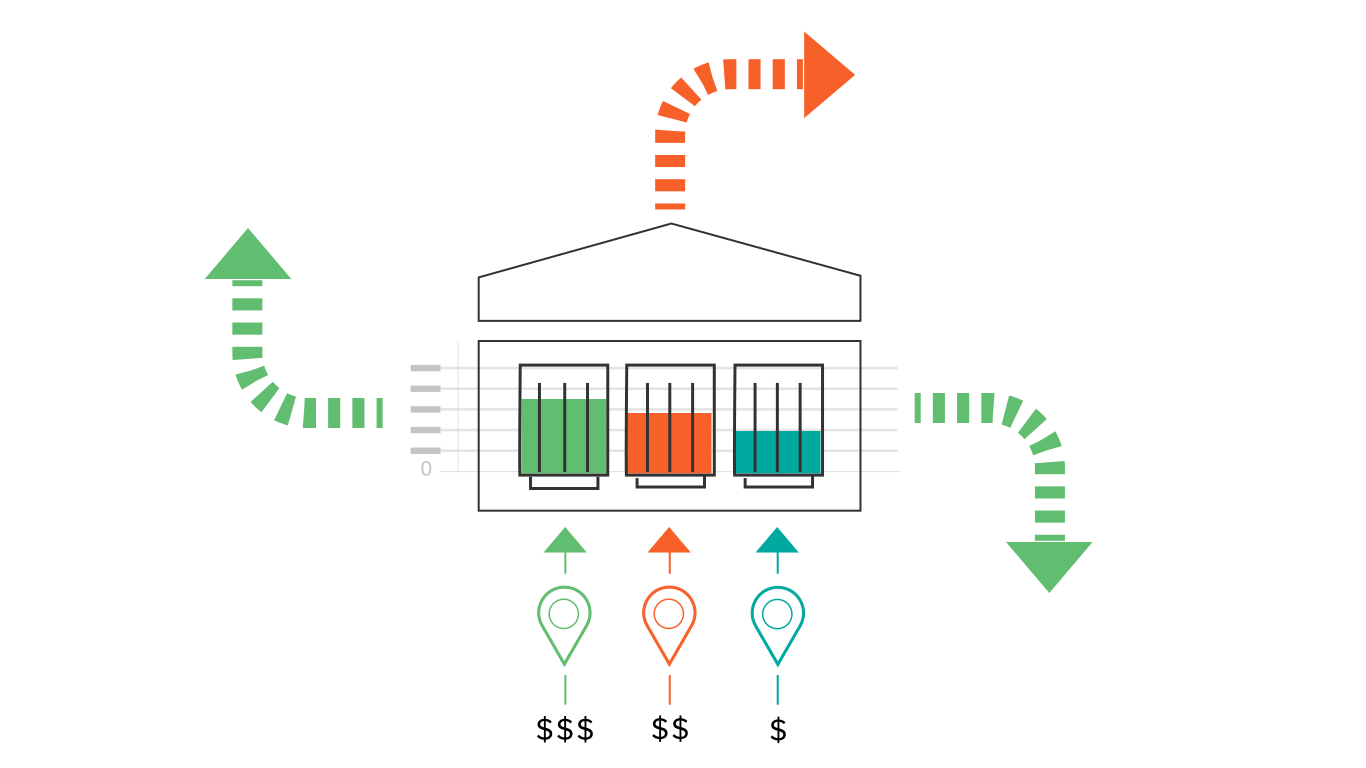
Put your data to work
Tipping fee analysis
Measure the average tipping fee charged by transfer stations operating in your jurisdiction and trend these averages over time.Material flow analysis
Analyze the amount of materials received by all transfer stations operating in your jurisdiction and the amount of materials shipped to other facilities or jurisdictions.
Profile the MRFs & recyclers in your jurisdiction
Start with the essentials
Collect fundamental information about each of the material recovery facilities (MRFs) and recyclers operating in your jurisdiction including facility name, address, contact information, permits, facility type, ownership details, and hours of operation.Understand operating capacity & materials accepted
Take inventory of each recovery facility's processing capacity, average throughput, service restrictions, design features, and materials accepted.Track tipping & processing fees
Measure each facility's published tipping fees and the costs for single-stream, dual-stream, source-separated, and material-specific processing.
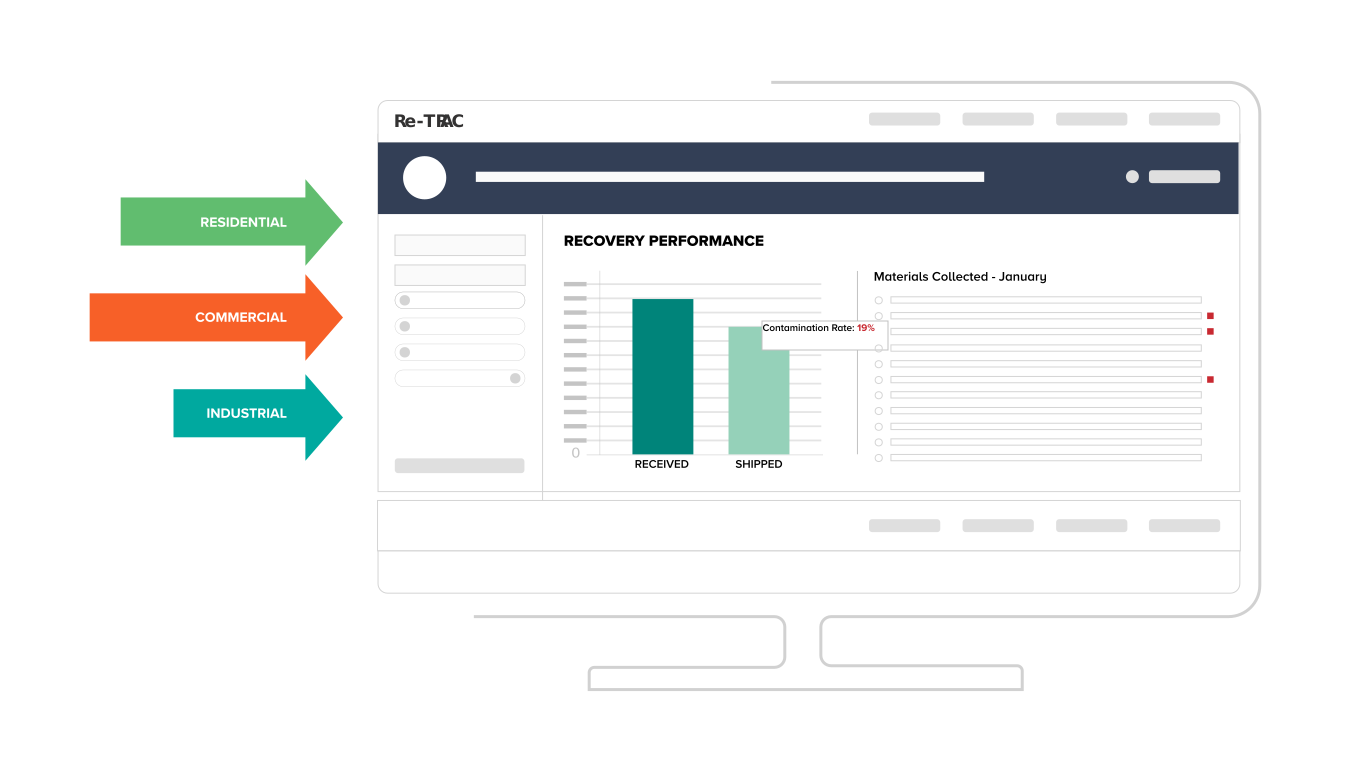
Measuring recovery performance
Track incoming & outgoing materials
Measure the total tons of recycling received from residential, commercial, and industrial sources, and the amount of material sent to end-markets or disposal facilities.Keep an eye on contamination rates
Monitor inbound contamination rates and residue rates to continuously improve throughput performance and the quality of outgoing commodities.Manage material inventories
Capture monthly material inventories including physical report documentation.
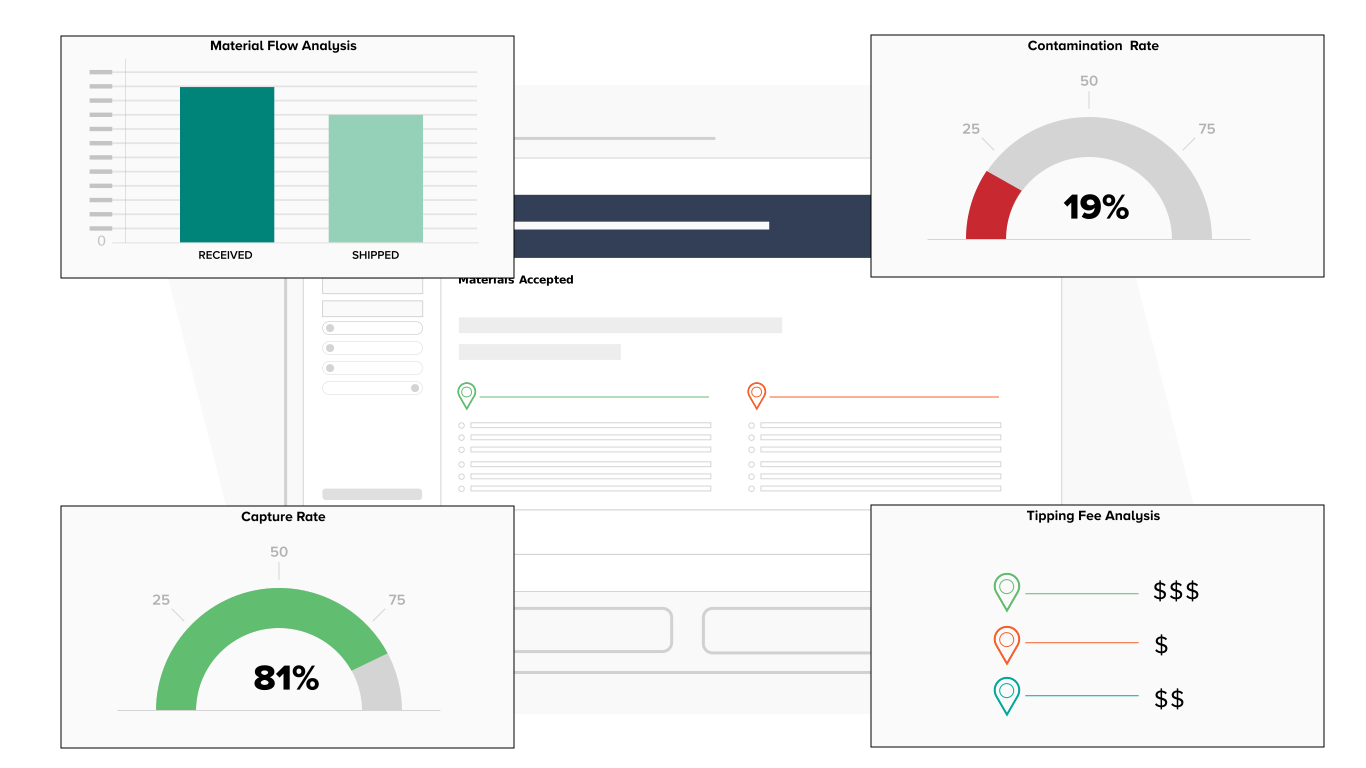
Put your data to work
Materials accepted analysis
View a summary of the materials accepted by the MRFs and recovery facilities operating in your jurisdiction.Capture rates
Calculate the percentage of inbound target recyclables that MRFs and processors successfully sorted & shipped to end-markets.Contamination rates
Calculate the percentage of non-recyclable or unwanted materials mixed in with the incoming stream of target recyclables.Material flow analysis
Analyze the amount of materials received by MRFs & processors in your jurisdiction and the amount shipped to end-markets, or landfills for disposal.Tipping fee analysis
Measure the average tipping fee charged by recovery facilities operating in your jurisdiction and trend these averages over time.
Profile the organics processors in your jurisdiction
Start with the essentials
Collect fundamental information about each of the organics processing facilities operating in your jurisdiction including facility name, address, contact information, permits, facility type, ownership details, and hours of operation.Understand operating capacity & materials accepted
Take inventory of each facility's processing capacity, average throughput, service restrictions, design features, and materials accepted.Track tipping fees
Measure each facility's published tipping fees for source-separated organics, food waste, and fats, oils, and grease (FOG) .
Measuring recovery performance
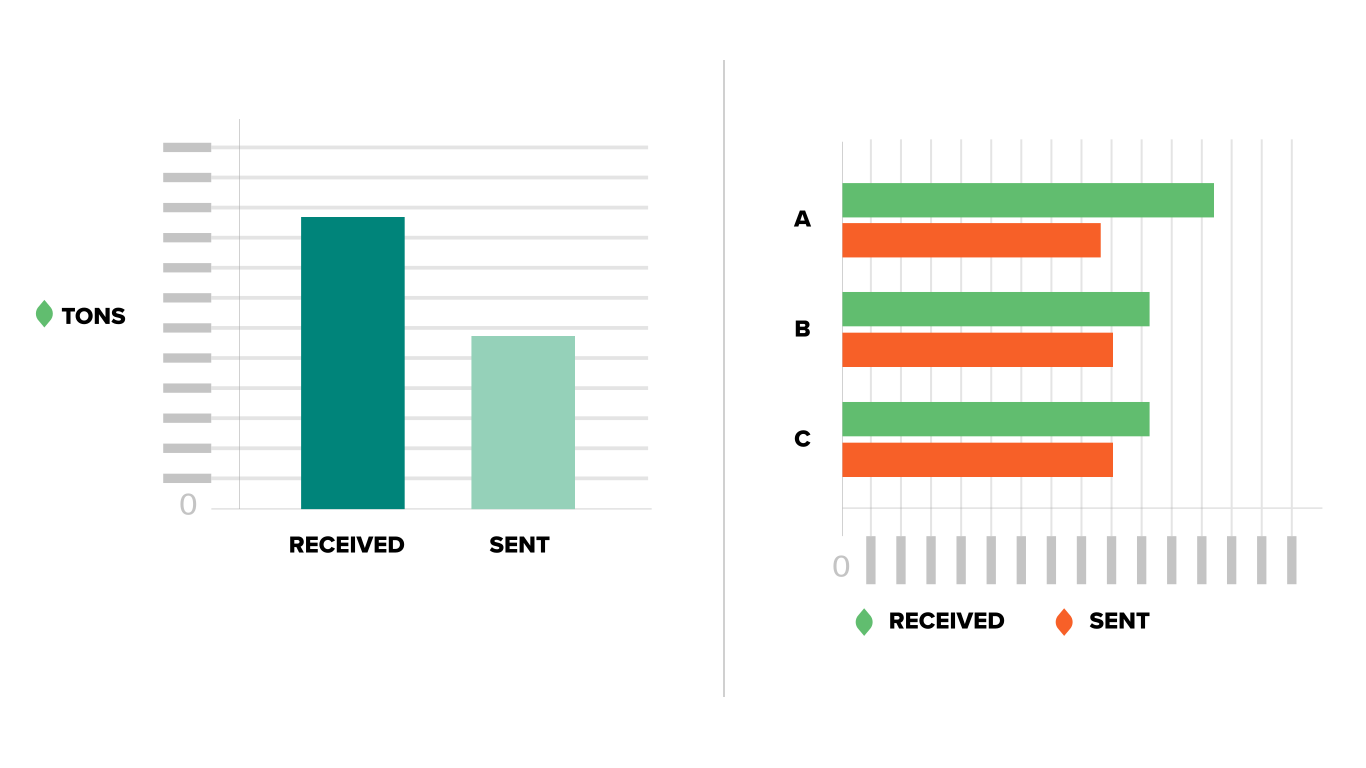
Track incoming & outgoing materials
Measure the total tons of organics received from residential, commercial, and industrial sources, and the amount of material sent to end-markets or disposal facilities.Keep an eye on contamination rates
Monitor inbound contamination rates and residue rates to continuously improve throughput performance and the quality of outgoing commodities.
Put your data to work
Materials accepted analysis
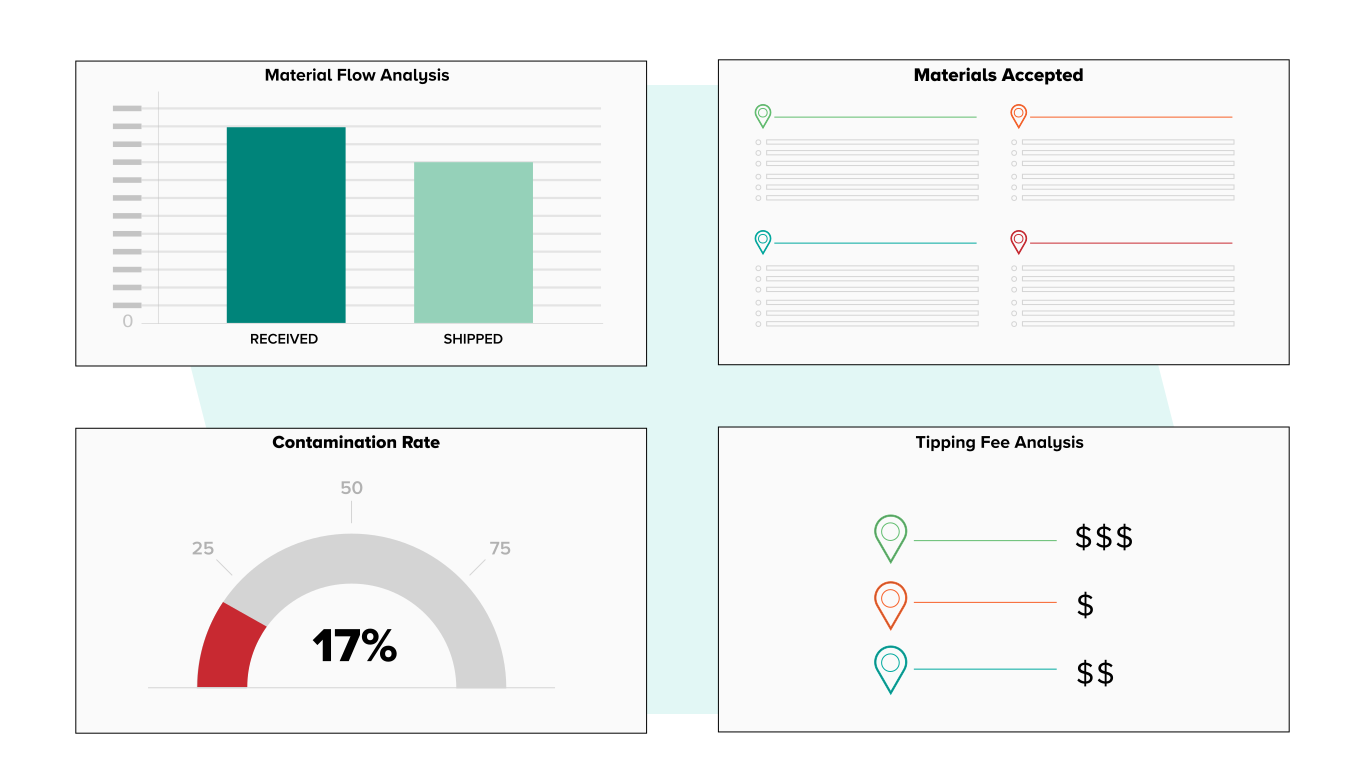
Generate a summary of materials accepted by composting facilities, wood chipping & mulching facilities, and anaerobic digesters in your jurisdiction.Material flow analysis
Analyze the amount of materials received by organics processing facilities and the amount shipped to end-markets, or landfills for disposal.Contamination rates
Calculate the percentage of unrecoverable or unwanted materials mixed in with the incoming stream of target organics.Tipping fee analysis
Measure the average tipping fee charged by organics processors operating in your jurisdiction and trend these averages over time.
EXCEPTIONAL CUSTOMER SERVICE
Customer Success Manager
A Customer Success Manager (CSM) will be assigned to you to guide you through every phase of your data collection program.
Data Experts
Our team excels at converting data collection & measurement needs into customized Re-TRAC programs that capture reliable, high-quality data.
Service you can trust
Our experienced Customer Success team consistently earns an average of 4.5 out of 5 stars for customer satisfaction.
;%20}%20%3c/style%3e%3clinearGradient%20id='linear-gradient'%20x1='83.08'%20y1='19.13'%20x2='18.94'%20y2='64.03'%20gradientUnits='userSpaceOnUse'%3e%3cstop%20offset='0'%20stop-color='%23ff0f7b'/%3e%3cstop%20offset='1'%20stop-color='%23f89b29'/%3e%3c/linearGradient%3e%3c/defs%3e%3cpath%20class='cls-1'%20d='M91.01,30.45v23.8s-5.08.99-6.13,1.13-4.31,1.19-6.69-1.09c-3.67-3.58-16.68-16.54-16.68-16.54-1.68-1.36-4.05-1.48-5.85-.29-3.3,1.74-8.22,4.3-10.26,5.29-2.25,1.32-5.14.56-6.46-1.69-.36-.61-.57-1.3-.63-2,.09-1.85,1.23-3.48,2.94-4.2,4.66-2.8,14.51-8.4,18.61-10.53,2.49-1.4,4.28-1.4,7.72,1.4,4.21,3.63,8.04,6.8,8.04,6.8.92.65,2.07.87,3.16.6,4.72-.98,12.24-2.69,12.24-2.69ZM39.2,70.66c.93-2.13-.05-4.6-2.17-5.53-.88-.38-1.87-.45-2.8-.2.47-1.46.13-3.06-.9-4.2-1.12-1.07-2.71-1.46-4.2-1.05.47-1.46.12-3.06-.91-4.2-1.89-1.74-4.82-1.66-6.61.18-1.93,1.85-3.18,5.21-1.4,7.2s3.7.77,5.21.42c-.42,1.5-1.68,2.9-.13,4.86,1.55,1.96,3.7.77,5.21.42-.42,1.5-1.62,3.02-.14,4.84s3.98.85,5.6.35c-.63,1.61-1.97,3.35-.25,5.31s5.71,1.05,7.66-.81c1.92-1.69,2.11-4.63.42-6.55-1.21-1.19-2.99-1.59-4.59-1.04ZM74.69,58.31l-15.02-14.95c-1.42-1.33-3.48-1.7-5.28-.95-2.1.92-4.8,2.18-6.85,3.14-1.41.84-2.98,1.36-4.61,1.54-4.32.04-7.86-3.43-7.9-7.75-.03-2.73,1.38-5.28,3.7-6.73,3.26-2.23,10.39-6.05,10.39-6.05-1.81-1.91-4.37-2.93-7-2.8-4.79,0-14.81,6.58-14.81,6.58-2.15,1.12-4.7,1.19-6.9.18l-7.81-2.72v27.16s2.23.64,4.2,1.4c.45-1.31,1.2-2.49,2.18-3.46,3.31-3.17,8.52-3.21,11.87-.08.9.93,1.54,2.07,1.88,3.32,1.21.38,2.32,1.05,3.21,1.96.9.95,1.54,2.11,1.86,3.37,2.61.81,4.58,2.94,5.19,5.6,1.27.36,2.43,1.05,3.35,2,1.74,1.82,2.51,4.36,2.07,6.85h0s1.12,1.26,1.81,1.95c1.35,1.35,3.53,1.35,4.87,0s1.35-3.53,0-4.87c0,0,2.8,3.47,5.99,1.4,2.8-1.96,2.37-4.28,1.04-5.6,1.59,1.89,4.4,2.13,6.29.55.14-.11.26-.24.39-.37,1.25-1.26,1.32-3.26.18-4.62,0,0,1.86,2.53,5.6.17,2.65-2.24,1.4-4.8,0-6.15l.11-.07Z'/%3e%3c/svg%3e)

;%20}%20.cls-2%20{%20fill:%20url(%23linear-gradient-4);%20}%20.cls-3%20{%20fill:%20url(%23linear-gradient-3);%20}%20.cls-4%20{%20fill:%20url(%23linear-gradient);%20}%20%3c/style%3e%3clinearGradient%20id='linear-gradient'%20x1='50.16'%20y1='71.72'%20x2='27.28'%20y2='87.74'%20gradientUnits='userSpaceOnUse'%3e%3cstop%20offset='0'%20stop-color='%23ff0f7b'/%3e%3cstop%20offset='1'%20stop-color='%23f89b29'/%3e%3c/linearGradient%3e%3clinearGradient%20id='linear-gradient-2'%20x1='70.33'%20y1='73.76'%20x2='53.34'%20y2='85.66'%20xlink:href='%23linear-gradient'/%3e%3clinearGradient%20id='linear-gradient-3'%20x1='63.39'%20y1='32.01'%20x2='36.61'%20y2='50.76'%20xlink:href='%23linear-gradient'/%3e%3clinearGradient%20id='linear-gradient-4'%20x1='73.77'%20y1='24.74'%20x2='26.23'%20y2='58.03'%20xlink:href='%23linear-gradient'/%3e%3c/defs%3e%3cpath%20class='cls-4'%20d='M49.08,72.8c-1.84-.34-3.27-1.68-4.44-2.78-.62-.58-1.47-1.38-1.91-1.49-.06-.02-.16-.03-.35-.03-.58,0-1.4.19-2.19.37-1.04.24-2.12.48-3.21.48-1.04,0-1.95-.23-2.73-.68-.25-.14-.47-.3-.68-.47l-7.95,17.17,9.88-.3,6.16,7.73,8.34-18.02.92-1.98c-.3.06-.6.09-.92.09-.32,0-.62-.03-.92-.09Z'/%3e%3cpath%20class='cls-1'%20d='M65.76,68.67c-.78.45-1.7.68-2.73.68h0c-1.1,0-2.17-.25-3.21-.48-.79-.18-1.61-.37-2.19-.37-.18,0-.29.02-.35.03-.44.12-1.29.91-1.91,1.49-.29.27-.6.56-.92.84l-3.13,6.75,7.03,15.18,6.17-7.73,9.88.3-7.95-17.17c-.21.17-.43.33-.68.47Z'/%3e%3cpath%20class='cls-3'%20d='M50,25.04c-9.03,0-16.35,7.32-16.35,16.35s7.32,16.35,16.35,16.35,16.35-7.32,16.35-16.35-7.32-16.35-16.35-16.35Z'/%3e%3cpath%20class='cls-2'%20d='M74.84,48.05c.61-2.26,4.27-4.2,4.27-6.66s-3.67-4.39-4.27-6.66c-.63-2.34,1.56-5.85.38-7.9-1.2-2.08-5.35-1.93-7.04-3.62-1.69-1.69-1.54-5.83-3.62-7.04-2.05-1.18-5.56,1-7.9.38-2.26-.6-4.2-4.27-6.66-4.27s-4.39,3.67-6.66,4.27c-2.34.63-5.85-1.56-7.9-.38-2.08,1.21-1.93,5.35-3.62,7.04-1.69,1.69-5.84,1.54-7.04,3.62-1.19,2.05,1,5.56.38,7.9-.61,2.26-4.28,4.2-4.28,6.66s3.67,4.39,4.28,6.66c.63,2.34-1.57,5.85-.38,7.9,1.2,2.08,5.35,1.93,7.04,3.62.78.78,1.16,2.07,1.56,3.36.33,1.1.67,2.19,1.26,2.96.22.3.49.55.8.73,2.05,1.19,5.56-1,7.9-.38,1.45.39,2.76,2.02,4.16,3.15.79.64,1.61,1.12,2.5,1.12s1.71-.48,2.5-1.12c1.37-1.11,2.66-2.7,4.07-3.13.03-.01.06-.02.09-.03,2.34-.63,5.85,1.56,7.9.38.31-.18.58-.43.8-.73,1.27-1.67,1.38-4.88,2.82-6.31,1.69-1.69,5.83-1.54,7.04-3.62,1.19-2.05-1-5.56-.38-7.91ZM50,60.8c-.38,0-.75-.01-1.12-.03-4.67-.27-8.9-2.18-12.1-5.17-3.81-3.55-6.19-8.59-6.19-14.2,0-10.72,8.69-19.41,19.41-19.41s19.41,8.69,19.41,19.41-8.69,19.41-19.41,19.41Z'/%3e%3c/svg%3e)
"Re-TRAC Connect streamlined reporting, made data verification easier, and improved the accuracy of data in Vermont."
Environmental Analyst
Vermont Department of Environmental Conservation


Facility Reporting
Easily manage and analyze data collected from landfills, material recovery facilities (MRFs), transfer stations, and composting facilities.
- Centralize reporting & improve data quality
- Eliminate error-prone spreadsheets
- Measure the total recovery & disposal capacity in your region
- Monitor material flows in and out of your jurisdiction
- Track tipping fees & charges


"Re-TRAC Connect streamlined reporting, made data verification easier, and improved the accuracy of data in Vermont."
Aric Brown, Environmental Analyst
Vermont Department of Environmental Conservation

Watch demo