New Features – January 2016
Tracker and Tracker Light
Enhanced Tracker Reports
You may have already noticed but this month we introduced the enhanced Tracker reports. We were so excited to tell you about the reports that we dedicated an entire blog post to them.
Topping the charts
As part of the newly enhanced Tracker reports, we also introduced two new styles of charts. These chart styles were added to make visual data analysis even easier for specific types of reports.
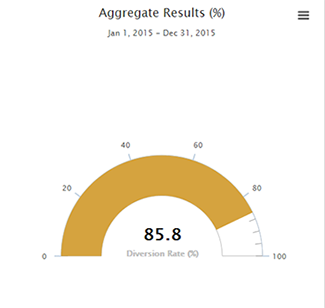
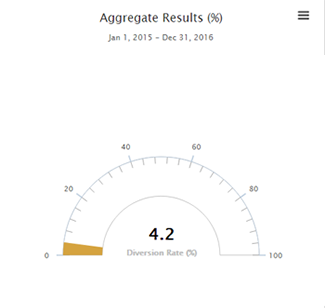
1. Gauge Chart
The gauge chart is currently used in the Diversion Rate Report. This chart style is best used for percentage values or to show progress on a scale.
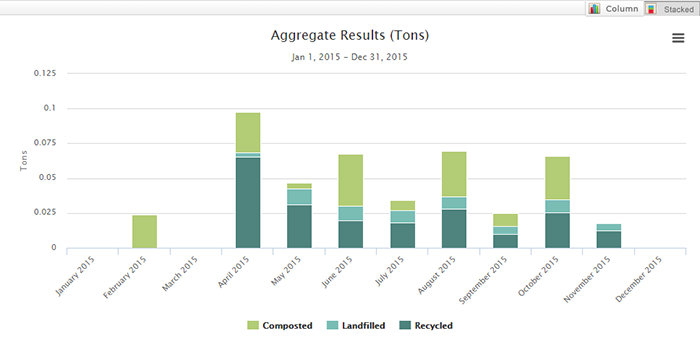
2. Stacked Columns
The stacked column chart is great for comparing proportions for a given data group. The stacked column chart aggregates a group of data into a single column. This chart type is available in the Trending Report.